Part Two: GIS surface analysis in archaeology
Part Four: Results and discussion
The Bulwark

Figure 1: The Bulwark fuzzy viewshed
© Base mapping Crown Copyright/database right 2012 (An Ordnance Survey/EDINA supplied service)
The Bulwark occupies a southeasterly aspect at the end of Llanmadoc Hill. This would suggest a corresponding viewshed, but as can be seen in figure 16 above it has almost a 270˚ view, with the westerly aspect obstructed by the summit of the hill. The multiple fort complex on Hardings Down is located where µ=0.33, the limit of visual recognition (p. 22), as is Stembridge Camp. Other sites are all beyond this range. The only other hillforts within the viewshed are Llandewi and Reynoldston Camp, but these are close to the maximum limit, over twice the distance to Hardings Down. Close to the fort the area of perfect acuity is interrupted by an area of dead ground directly to the northeast and is abruptly curtailed to the west. The limited view to the west and southwest suggests that this was not considered an area from which a potential attack might arise. The best view is to the southwest where there is little interruption and it could therefore be that the sloping land in this area was the primary area of interest.
Cil Ifor


Figure 2: Cil Ifor fuzzy viewshed
© Base mapping Crown Copyright/database right 2012 (An Ordnance Survey/EDINA supplied service)
Cil Ifor is probably the most defensive hillfort on Gower. It occupies a small ridge giving extensive views to the northwest and apart from the small area to the immediate north, has virtually all-round visibility up to the limit of clear acuity. The view is abruptly curtailed by the long ridge of Cefyn Bryn to the southeast, but it would be possible to see anyone crossing the ridge as they were outlined against the sky. There is also a good view of the coastal salt marsh which would permit easy observation of approaches from the sea. The view is more fragmented to the southeast, obstructed by areas of slightly rising ground.
Hardings Down
This complex of three structures, one apparently unfinished, will be considered as a group. Figures 3-5 below show the fuzzy viewsheds from each site:


Figure 3: Hardings Down East fuzzy viewshed Figure 4: Hardings Down West fuzzy viewshed


Figure 5: Hardings Down North fuzzy viewshed
© All maps base mapping Crown Copyright/database right 2012 (An Ordnance Survey/EDINA supplied service)
Hardings Down East
Hardings Down East hillfort (figure 3) is unusual in that it appears to be unfinished. The eastern defences are fairly complete but to the west there are short lengths of unconnected bank and ditch which suggest a method of construction which was piecemeal and started at separate points. These presumably would have eventually been joined, but the method of construction is not the primary interest here. Rather it is to attempt to answer a question: Was the east site started and then abandoned in favour of the western one, or was it started after the west site had been constructed but for some reason not finished?
Hardings Down West
Noticeable at Hardings Down West (figure 4) is the significant loss of view to the southeast, due to its position on the west slope of Hardings Down. Three other hillforts are within its viewshed, Tor-Gor, Burry Holms and The Bulwark, although only the latter is within the 0.33 v.i. limit. Apart from the gap at the north of Rhossili Down the view to the west is limited. The ridge of Rhossili Down would however expose anyone approaching from this direction through being silhouetted against the sky. The area of clear visibility extends around the whole of the visible area, so easily monitored, but the obstructed view to the east would be a serious vulnerability. The existence of two outer banks and ditches across this area suggests an attempt to improve defences, but even from here the view extends little beyond the eastern fort site.
A clue may be in the viewshed, which covers much of the west fort’s view, but in addition provide an extensive view to the southeast. Five other hillforts are in view, including the three visible from the west fort. There is an area of dead ground to the northwest which is covered by the west fort, but apart from this the view is far superior. This suggests that the east fort was constructed after the west fort, either to enable the area to the east to be observed, or simply to improve the all-round defensive position. There seems little reason to abandon this site in favour of the west fort. It is possible that the west fort would be built as an additional outer defence or observation area, but there would then be no need for the defensive banks and ditches between the forts. The assumption here is of course that the purpose of the two ditches was defence, but they could possibly have served some other purpose, such as a demarcation between the two sites.
Hardings Down North
This small
site appears to offer little advantage over the two larger forts. Its viewshed is overlapped by the west and
east forts and the simple construction of a single bank and ditch could suggest
an enclosure, either for religious or other ceremonial use as a defensive
structure around a hut or farmstead.
Burry Holms


Figure 6: Burry Holms fuzzy viewshed
© Base mapping Crown Copyright/database right 2012 (An Ordnance Survey/EDINA supplied service)
The site at Burry Holms has a strongly seaward orientation to its viewshed, which would suggest it should be classified as a promontory fort. Unlike the other promontory forts on Gower it also has an inland view and is the only fort which has a view along the coastal side of Rhossili Down. The Hardings Down complex is close to the periphery of the visible range, but apart from Old Castle (a defended enclosure) no other sites are within view. Its location suggests that the peninsula of Burry Holms (which is separated from the mainland at high tide) was chosen primarily for its defensive position.
Hen Gastell


Figure 7: Hen Gastell fuzzy viewshed
© Base mapping Crown Copyright/database right 2012 (An Ordnance Survey/EDINA supplied service)
The strongly coastal orientation of the viewshed with the area of clear visibility limited to the marshes directly to the north, suggests a promontory type fort rather than a hillfort. No other sites are within view, which indicates that it could alternatively be a defended enclosure rather than a fort.
Llandewi

Figure 8: Llandewi fuzzy viewshed
© Base mapping Crown Copyright/database right 2012 (An Ordnance Survey/EDINA supplied service)
An extensively fragmented
view surrounds this location. The area of clear visibility is noticeably
isolated and only the forts of Reynoldston Camp and The Bulwark are in view,
along with the small Druid’s Moor enclosure.
Norton Camp


Figure 9: Norton Camp fuzzy viewshed
© Base mapping Crown Copyright/database right 2012 (An Ordnance Survey/EDINA supplied service)
Whilst the view is clear to the ridge of Cefyn Bryn to the north and east, with Reynoldston Camp on the periphery to the north, this does not suggest a significant fort. The fort at Pennard Hill is barely in sight and none of the sites to the west and northwest are visible. This could be more of a defended enclosure, as in the case of Llandewi.
Pennard Hill


Figure 10: Pennard Hill fuzzy viewshed
© Base mapping Crown Copyright/database right 2012 (An Ordnance Survey/EDINA supplied service)
Another site with a severely limited view, Pennard Hill again suggests a defensive position with characteristics more like an enclosure. No other sites are within view and the land area extends little beyond the clear zone of visibility.
Reynoldston Camp


Figure 11: Reynoldston Camp fuzzy viewshed
© Base mapping Crown Copyright/database right 2012 (An Ordnance Survey/EDINA supplied service)
The view from this site is constricted on the northeast by the ridge of Cefyn Bryn, but extends westwards to Hardings Down and The Bulwark at the limit of visibility. The sites at Llandewi and Berry Wood are within the 0.33 limit, as are the enclosures at Mount Brough and Druid’s Moor. As with the sites at Hardings Down and The Bulwark, the main viewshed covers the area bounded by the slopes of Rhossili Down and Cefyn Bryn, but no part of the coast is visible.
Combining
the fuzzy viewsheds – the progression from viewshed to visualscape
Before discussing the result of combining fuzzy viewsheds, it will be useful to consider briefly the result of creating a simple binary cumulative viewshed. This can then be compared with the more sophisticated result obtained by using fuzziness. To create the binary viewshed, each separate viewshed is converted to a raster where the viewshed pixel values = 1 and all other pixels = 0. Using a simple update query the rasters can be added together. Each pixel will have a value in the range 0 (not visible from any hillfort) to 12 (visible from all hillforts). In this case the maximum number of overlapping viewsheds is 7. Figure 12 shows the result of combining the binary viewsheds for each of the twelve hillforts.

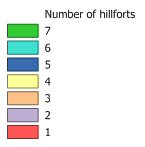
Figure 12: Cumulative binary hillfort viewshed map (number of overlapping viewsheds)
© Base mapping Crown Copyright/database right 2012 (An Ordnance Survey/EDINA supplied service)
The map in figure 12 clearly shows an area in central western Gower which is visible from several hillforts and this could suggest an area of settlement and farming. This does not however take into account the distance from each hillfort, so the fuzzy approach would be more appropriate. A similar map can be created by combining the separate fuzzy viewsheds, but in this case simply adding the pixel values will give a meaningless result. The pixel value in the fuzzy viewshed is an index, so an area covered by two overlapping viewsheds where both visibility indexes are for example 0.5 does not mean the area has a value of 1.0. The visibility is still the same from each hillfort. If however one viewshed has a value of 0.3 and the other 0.5, the visibility index will be 0.5 as one hillfort is closer than the other. This means that rather than the summed value, the maximum value of all overlapping viewsheds will be used. The result is shown in figure 13:

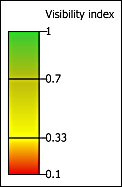
Figure 13: Combined fuzzy viewshed map
© Base mapping Crown Copyright/database right 2012 (An Ordnance Survey/EDINA supplied service)
The result is a less
fragmented coverage and a number of observations can be made. Each hillfort clearly shows its own area of
clear visibility and there are clear zones of separation between them. With the exception of the Hardings Down group,
each individual hillfort appears to be beyond the clear visual range of its
neighbours, but within the limit of human acuity. There are a few scattered areas which fall
beyond the 0.33 value, but much of the area of western Gower is within the
visual range of 0.7 and this area is much larger than the binary viewshed map
would suggest. It is most noticeable in
the area to the north, which although it is visible from only one or two sites
is nevertheless under good visibility. These
areas could be significant for both defensive and administrative reasons. The former requires a clear view to avoid
surprise attack and the latter enables farming and other activities to be
monitored. People working and living within the region would be aware of at
least one hillfort maintaining a watch almost wherever they were. Interestingly
the areas of poor visibility are mostly on the east or north-easterly slopes
which would offer poor farming and so less likely to be settled.
Conclusion
The aim of this project was to explore new approaches to the use of landscape analysis in a GIS to explore the pattern of hillforts and other defended sites on Gower. Rather than attempt to defend the traditional binary viewshed approach which has been criticised as being unrealistic and misleading, a more sophisticated methodology has been proposed and demonstrated. A further criticism which often occurs in the literature is that the human aspect is lacking from landscape analysis. Too much emphasis is placed on the physical landscape (height, aspect and slope, for example). This project proposes that the issue of human acuity should be considered when performing viewshed analysis through the application of mathematical processing to apply a ‘fuzziness’ factor to the result.
This approach suggests new ways of interpreting the landscape are possible which can introduce more uncertainty. That may seem a backward step
which contradicts the urge to
produce ever more accurate and precise data. There is the danger however that
archaeology by reducing everything to spatial data existing in a virtual
model of the landscape. The ability of a
spatial data from surfaces and terrains through its ability to use spatial queries makes it a powerful tool, but it should be used with caution. This project
shows there is the potential to further understand the way Iron Age
people used their landscape by enhancing the modelling power of
addition of
human characteristics and uncertainty.
Part Two: GIS surface analysis in archaeology
© Estate of Nigel James 2013